The Breakpoints View
With this view, you can overview and manage the breakpoints used for debugging. You can find this view in the Debug activity tag with the BreakPoints header:
This view displays every breakpoint, whether you created it here, with an interactive command, or in the source code. Each line represents a particular breakpoint with this information:
-
A checkbox shows if the current breakpoint is enabled or disabled. You can set this status by toggling the checkbox.
-
A filled circle representing the status of a breakpoint:
- cyan: This breakpoint has been created with an interactive command.
- red: This breakpoint has been created in the source code.
- orange: This color indicates that a breakpoint has been created in the source code but not resolved to an actual address as the code has not been compiled (after opening the project or editing the code).
- gray: This breakpoint has been disabled.
The circle has an = mark in it when the breakpoint has a condition or a hit count rule, and is hollow when its condition cannot stop the machine right now — see Conditions and Hit Counts. The same shapes appear in the editor’s margin and in the Disassembly View.
-
An icon representing the breakpoint type
-
The breakpoint’s address or source code location
-
Other information (such as the disassembly at the location)
-
For a breakpoint with a condition or a hit rule: the live hit count (
9×), the rule (hit *4) and the condition (if A == $FF). The condition is shortened in a narrow sidebar; hover the row to read it in full.
Manipulating Breakpoints
When you hover the mouse over the first two icons, they display additional information:
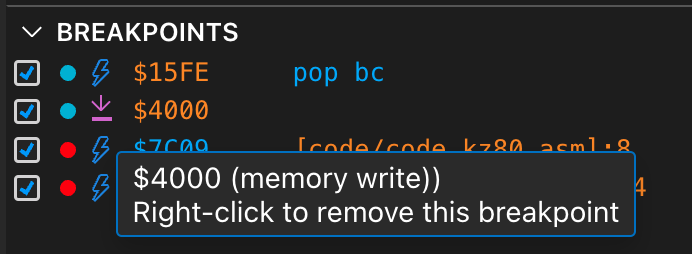
With the right mouse button on a breakpoint’s indicator, you can remove that breakpoint. If you want to deactivate one temporarily, disable it by clearing the checkbox on its left.
The toolbar at the top of the view adds two more actions:
- Add breakpoint (the + button) opens the breakpoint dialog described below.
- Remove all breakpoints erases the whole set. This is the same operation as the
bp-eacommand, so it removes source-code breakpoints as well; the confirmation tells you how many of those are about to go.
Right-clicking a breakpoint’s row opens a menu with Edit breakpoint, Remove after it stops (or Keep after it stops on a one-shot), Enable/Disable, Remove breakpoint, Reset hit count, Reset all hit counts and Remove all breakpoints. On a memory breakpoint whose address a build symbol starts at, it also offers Add to Watch, which adds a watch over the same bytes. Double-clicking a row opens the editor directly. You can also double-click a breakpoint’s indicator in the Disassembly View to edit it there.
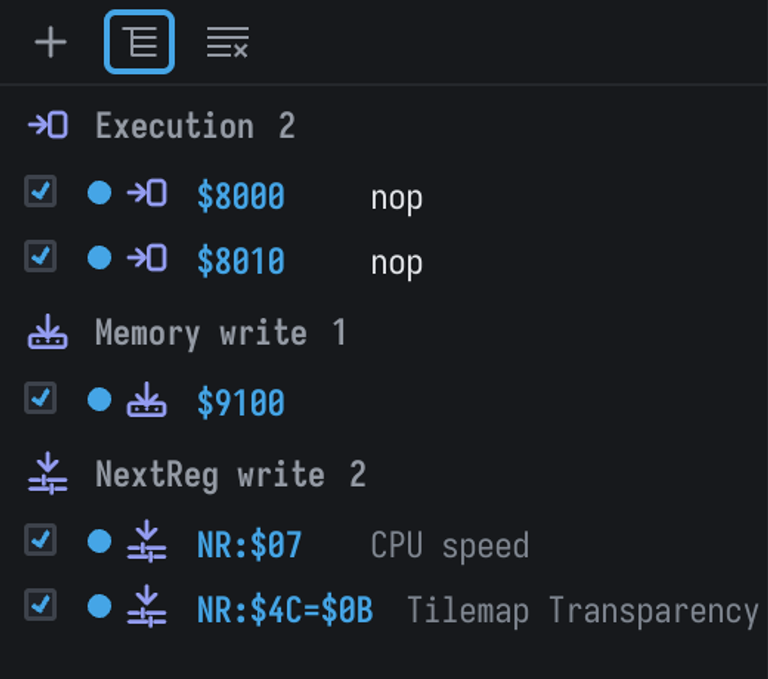
The view is grouped by kind, under a header carrying that kind’s icon and a count; a kind with no breakpoints gets no header. The third toolbar button turns the grouping off, which hides the headers — useful when you are watching a handful of breakpoints in one routine and the header is a row that tells you nothing. It does not reorder the rows: within a kind they are sorted by address, and that sorting applies either way, so the list no longer reshuffles as you add and remove breakpoints.
One-Shot Breakpoints
A one-shot breakpoint removes itself the first time it stops the machine — “stop here once”. Hold Shift and click:
- the margin beside a line in the editor, or one of its inline statement markers;
- the breakpoint gutter of the Disassembly View.
Shift+click where there is no breakpoint adds a one-shot, on a regular breakpoint turns it into a
one-shot, and on a one-shot removes it. The same is offered by name: Add One-Shot Breakpoint and
Remove After It Stops / Keep After It Stops in the editor’s margin menu, Stop Here Once
in the editor’s own context menu, the disassembly row menu, the Remove after it stops checkbox of
the breakpoint dialog, the Breakpoints view’s row menu, and -once on
bp-set.
A one-shot can be any kind of breakpoint, and it keeps its condition and hit rule: it is removed the
first time those let it stop. So a one-shot with -hit 10 stops on the tenth hit and is then gone,
and a one-shot whose condition is false is not removed just because another breakpoint stopped the
machine at the same address.
It is drawn as the breakpoint dot with a 1 in it, and with a condition or hit rule as a 1
over a bar; the Breakpoints view marks it once. One-shots are never saved with the project.
Making one a regular breakpoint again (Keep After It Stops) puts it back in the project.
Running To A Line
Holding Ctrl (Cmd on macOS) and clicking the breakpoint margin beside a line runs the machine until it reaches that line, then stops. No breakpoint is left behind: the one Klive uses is removed as soon as it is reached, and it is never written to your project. The gesture is listed in the margin’s tooltip along with the right-click and double-click actions.
This works in the Disassembly View and in a popped-out ZX Spectrum Next bank, where
it runs to an offset inside that bank — wherever the bank happens to be paged. In the live
Disassembly View, right-clicking a row outside the gutter opens a menu with the gutter’s gestures by
name: Add/Remove Breakpoint, Add One-Shot Breakpoint, Run to Here and Edit
Breakpoint…. A run-to target never replaces a breakpoint you set at the same place. The same action
is available as the run-to command, which also explains what happens
when the machine is running rather than paused.
The Breakpoint Dialog
The Add breakpoint button and the Edit breakpoint command both open a dialog that offers
every option the bp-set command accepts, without the flag syntax:
- Type — execution, memory read, memory write, I/O read, I/O write, or, on the ZX Spectrum Next, NextReg write, Copper instruction and sprite attribute write. A breakpoint has exactly one type, so choosing one here replaces the last. Choosing NextReg write replaces the address field with a register chooser and hides the partition row, because that type names no place; it adds a value filter and a copper checkbox of its own. See NextReg Write Breakpoints.
- Break only in a specific partition — shown only on machines that page ROMs or banks, and not available for I/O breakpoints, which watch a port rather than a partition. Ticking it reveals the same partition chooser the Memory View uses: a short list on a machine with a handful of banks, and the bank matrix on a machine like the ZX Next, whose 247 partitions no list could sensibly hold. The names it offers are the machine’s own; see Machine-Specific Memory Partitions.
- Address (or Port, for the I/O types) — accepts the same literals the commands do:
$8000,32768or%1000000000000000. On the ZX Spectrum Next it also accepts the bank-relative form,05:+$0100, described below. Typing one disables the partition row: a bank-relative breakpoint already names its bank, so there is nothing left to choose. - Port mask — only for the I/O types. Leave it empty to match the port exactly.
- Length — only for the memory types: how many bytes to watch from the address, so one breakpoint can guard a whole buffer. Leave it empty for one byte.
- Condition — an expression; the breakpoint stops only when it is true. It is checked as you type, against the machine and the last build: a mistake is shown under the field with its column, and a label the last build did not define is a warning (the breakpoint is saved, but does not stop until a build defines the label). The Syntax link opens the reference below.
- Hit count — Always, or stop when the number of hits is Equal to, Greater than, At least, Less than or At most a number, or on Every Nth hit.
- Hits so far — when editing, the live count, with a Reset button.
- Enabled — clear this to create a breakpoint that is set but not armed.
- Remove after it stops — makes it a one-shot.
The dialog refuses an address that already has a breakpoint of the same type rather than silently
merging the two, which is what bp-set does on the command line.
Source-code breakpoints belong to the editor, which places them when you click in the left margin
beside a line and moves them with the line as you edit. Opened on one, the dialog shows its
Location (and the address it resolved to) instead of the type, address and partition rows, and
edits only its condition, hit count and enabled state. To script one, use bp-set [myfile.asm]:12.
The Editor’s Breakpoint Margin
Clicking the margin beside a line adds or removes a breakpoint. Right-clicking it opens a menu:
- on a line with a breakpoint: Edit Condition… and Edit Hit Count… (both open the dialog, on that field), Convert to Logpoint…, Disable/Enable Breakpoint, Reset Hit Count and Remove Breakpoint;
- on a line with a logpoint: Edit Log Message…, the same condition and hit count items, Convert to Breakpoint, and the rest as above;
- on a line with a breakpoint, also Remove After It Stops (or Keep After It Stops), which makes it a one-shot or a regular breakpoint again;
- on a line without one: Add Breakpoint, Add One-Shot Breakpoint, Add Conditional Breakpoint… and Add Logpoint…; the last two add the breakpoint and open the dialog on its condition or message — Cancel removes it again.
The same menu works on the inline statement markers of languages with several statements on a line. Hovering a breakpoint in the margin shows its condition, hit rule, hit count and, when it cannot stop, why.
Conditions And Hit Counts
Every breakpoint — execution, memory, I/O, NextReg, bank-relative, label-anchored and
source-code — can carry a condition and a hit count rule. The machine stops only if
the condition is true; a hit is counted only when it is, and the rule then decides whether this hit
stops. A hit is counted once each time the program reaches the breakpoint - also when you step onto
it and on from it, or when you go back to it in the execution history.
Set them with -if and -hit on bp-set, in the breakpoint
dialog, or from the editor’s margin menu. Conditions work on the Z80 machines.
A == $FF && !ZF
HL > $C000
(B & %0000_0111) == 3 || CF
[IX+3] == 0
w[$5C3A] > 100
wbe[$8000] == $1234
l[HL] == "KLIV"
sb[IX+2] < -1
s16(HL) < 0
b[05:$C010] == $FF
w[0A:+$0100] == score
VAL == $C9
ADDR >= $5800 && ADDR < $5B00
page($C000) == @B5
nr($56) == $0A
w[score] >= 1000
AF' == $0044
Values
| Form | Example | Notes |
|---|---|---|
| Decimal, hexadecimal, binary | 100, $FF, 0xFF, %1010, 0b1010 | _ separates digits: %0000_0111 |
| Character | 'A', '\x7F', '£' | One character, as its ZX Spectrum code (£ is $60, © is $7F, ↑ is $5E); escapes \\ \' \" \n \r \t \0 \xHH |
| String | "KLIV" | Only compared (==, !=) with an unsigned memory read of the same length: 1, 2 or 4 characters, in memory order |
| Partition | @B5, @R0, @0A | A partition name, to compare with page(…) |
Registers, flags and specials
Names are case-insensitive.
- 8-bit registers:
A F B C D E H L I R IXH IXL IYH IYL(alsoXH XL YH YL). - 16-bit registers:
AF BC DE HL IX IY SP PC WZand the shadow setAF' BC' DE' HL'. - Flags, each 0 or 1:
SF(sign),ZF(zero),F5ForYF(bit 5),HF(half carry),F3ForXF(bit 3),PVF,PForVF(parity/overflow),NF(subtract),CF(carry).CandHare registers, which is why the flags have their own names. VAL— the byte read or written (memory), the port value (I/O), the new register value (NextReg).ADDR— the address or the 16-bit port accessed. Not on execution breakpoints.
Memory
| Read | Bytes | Range |
|---|---|---|
[a], b[a] | 1 | 0 … 255 |
w[a] / wbe[a] | 2, little- / big-endian | 0 … 65535 |
l[a] / lbe[a] | 4, little- / big-endian | 0 … $FFFFFFFF |
sb[a], sw[a], swbe[a], sl[a], slbe[a] | signed versions | two’s complement |
The address is any expression: w[HL], [IX+3], w[score].
w[HL]reads memory as the CPU sees it now; the address wraps at$FFFF.b[05:$C010]reads partition05at the offset of$C010, whatever is paged in — the same spelling asbp-set 05:$C010.b[0A:+$0100](ZX Spectrum Next) reads 16K bank0Aat offset$0100.b[05:Flags](ZX Spectrum Next) reads the bank-local labelFlagsof a.nex.dissidecar in bank05. Writeb[05:(score)]to use a global label as a partition offset instead.- Outside brackets,
05:Flagsis the value of an annotation label in bank05on every machine with banks, andROM:SA_BYTESthe address of a ROM label. - On a machine without banks, the part before the colon is ignored.
Reading memory in a condition has no side effects on the machine.
Functions
page(addr) is the partition paged in at addr; nr(reg) is a Next register’s value (ZX Spectrum
Next); s8(x), s16(x) and s32(x) read the low 8, 16 or 32 bits of x as a signed number.
Four functions take no argument and read the machine: tstates() is the number of T-states since
the machine started, cpufreq() the current CPU clock in Hz (turbo included), frame() the number
of frames since the machine started, and slots() the partition paged into each slot, as text
(R0 B5 B2 B0) — so slots() can only be a whole logpoint placeholder.
Operators
From the lowest precedence to the highest: ||; &&; the comparisons == != < <= > >=; |; ^;
&; the shifts << >> >>>; + -; * /; and the unary ! ~ -. / divides whole numbers,
dropping the fraction (7 / 2 is 3, -7 / 2 is -3); dividing by zero makes the condition fail
safe, so the breakpoint stops. There is no % operator: % starts a binary number. Bitwise operators bind tighter than
comparisons, so A & $80 == 0 means (A & $80) == 0. Comparisons cannot be chained.
Arithmetic and comparison work on exact numbers, so signed and unsigned values compare correctly.
& | ^ ~ give an unsigned 32-bit result (~0 == $FFFFFFFF); the shifts work exactly as in
JavaScript (1 << 31 is negative; write (x << n) >>> 0 for an unsigned result).
Labels
Any other name is a label of the last successful build (and, for a .nex file, its .nex.dis
sidecar), resolved again after every build. Register and flag names win; write a label that
collides with one in backticks: w[`ZF`].
A condition that names a label the last build did not define is inactive: the breakpoint does not stop and does not count, and the view shows it hollow and muted, with the reason in its tooltip. It comes back by itself once a build defines the label.
Checks
A condition is checked when you set it: a syntax error, a string of the wrong length, VAL on an
execution breakpoint, a partition the machine does not have, or a constant that the value it is
compared with can never hold (b[HL] == $1234, A > 300, A > -1, ZF == 2) is refused with its
column. The range check applies to constants written as literals - numbers, negative numbers,
characters and partition names; a constant written as an expression (A == 255 + 1) is not checked,
and simply never matches.
Conditions are evaluated inside the emulated machine’s core, next to its registers and memory, so a condition costs little even on an address the program passes thousands of times a second.
Hit counts
| Rule | Stops on hit… |
|---|---|
10 or =10 | 10 only |
>10 | 11, 12, … |
>=10 | 10, 11, … |
<10 | 1 … 9 |
<=10 | 1 … 10 |
*10 | 10, 20, 30, … |
Each breakpoint counts its own hits. The counters start from zero when the machine restarts
(Start after Stop, Restart, a reset) and when you reset them — from the view, the dialog,
the editor’s margin or bp-reset-hits. Pausing, stepping and
editing the breakpoint keep them.
Logpoints
A logpoint is a breakpoint that logs a message instead of stopping. When a debug run reaches it, its message is filled in from the machine’s state and written to the Log output pane, and the program goes on as if nothing had happened.
A logpoint is set like any breakpoint — at an address, a partition address, a bank-relative
address, a source line, or on memory, I/O and NextReg access — and can carry a condition and a
hit rule: then it logs only when the condition is true and the rule says so, and its hit counter
counts the lines it logged. Set one with -log on bp-set, with the
Action row (Log message) of the breakpoint dialog, or with Add Logpoint… in the editor’s
margin menu:
bp-set $8000 -log "x={A} at {PC:hex16}"
bp-set [code/code.kz80.asm]:42 -log "[LOOP] B={B}" -hit *100
bp-set $5800 -w -log "attribute {ADDR} = {VAL:bits}"
In the margin, the Breakpoints view and the disassembly, a logpoint is drawn as a diamond rather than a dot, with the same ”=” and hollow variants. When a logpoint and a breakpoint that stops share an address, the logpoint logs and then the machine stops.
A logpoint logs once each time execution arrives at it: continuing or stepping from a logpoint the machine is sitting on does not log it a second time.
The message
x={A} at {PC:hex16}
[SPRITES] sprite {B} at {w[IX+2]:hex16}, visible={b[IX+4] & $80 != 0}
{{literal braces}} and a dollar $ sign{opens a placeholder and}closes it; write{{and}}for literal braces.- A placeholder holds a full condition expression, so
{A == 3}prints 0 or 1. - An optional
:formatends a placeholder. Only a:outside brackets and parentheses followed by a format name counts, so{b[05:$C010]}and{05:Flags}keep their meaning; a bank-local label whose name is a format name is written in parentheses:{(05:hex8)}. - A leading
[NAME](letters, digits,_and.) is the logpoint’s group and is not printed. Without one, the group isDEFAULT.
| Format | Prints | Value $F3 |
|---|---|---|
hex8 / hex16 | 2 / 4 hexadecimal digits, no $ | F3 / 00F3 |
uint8 / uint16 | the low 8 / 16 bits, unsigned | 243 |
int8 / int16 | the low 8 / 16 bits, signed | -13 |
bits | binary: 8 digits below 256, otherwise 16 | 11110011 |
string | the value is an address: the bytes there up to a 0 (at most 64), with £, ©, ↑ mapped back | HELLO |
| (none) | a bare register, flag, VAL, ADDR or unsigned memory read: $ and as many digits as it reads ($3F, $C000; a flag prints 0/1); anything else in decimal | $F3 |
A message is checked as you type it, with the same column-accurate errors as a condition. A
division by zero prints <division by zero> in place of the value, and the line is still logged.
The Log pane
Each line reads [GROUP] message @ $8012 — the group, the message, and where it fired. The
first line of a debug session also leaves a note in the Emulator pane. At most 256 lines are kept
per frame; a logpoint in a tight loop that produces more reports the rest as one line
(… 1 234 log lines dropped in this frame), so the IDE stays responsive. Logpoints work in debug
runs only, on the Z80 machines.
Groups
Groups can be switched on and off without touching the logpoints themselves:
lp-en switches all of them, or logs only the groups you name, and
lp-groups lists them. In the Breakpoints view, the Log groups
section has a checkbox for each group. The switch is saved with the project. A logpoint logs only
when both it and its group are enabled.
DeZog LOGPOINT comments
Klive reads DeZog ’s logpoint comments, so a DeZog-annotated project logs unchanged:
DrawSprite:
    ld a,(hl)        ; LOGPOINT [SPRITES] Status=${A:hex8}, Counter=${b@(sprite.counter)}
Every build turns each LOGPOINT comment into a logpoint at the address of its line. It fires
before that instruction runs; a comment on a line of its own, or after a label alone, fires at
the next instruction. The keyword is case-sensitive. Each expansion of a macro holding one gets its
own logpoint, and comments in an IF branch that is not assembled are ignored.
These comments use DeZog’s own notation:
${expression}or${expression:format}; every other character, a lone$or{included, is literal text. The formats are the ones above.- Registers (
A,HL,IXL,AF'…), labels with their full dotted name (sprite.counter), and memory readsb@(address)(a byte) andw@(address)(a word). Parentheses alone only group:(HL)is HL, not memory. - Numbers as
31,0x1For1Fh. - C’s operators and precedence — unlike Klive’s own conditions, comparisons bind tighter
than
&, soA & 0x0F == 3meansA & (0x0F == 3)— plus*,/and%on whole numbers. ${Remote.tStates},${Remote.cpuFrequency}and${Remote.slots}. Division drops the fraction, so DeZog’s${Remote.cpuFrequency/1000000}MHzprints3MHzfor a 3.5 MHz machine.
The logpoints belong to the build: they are not saved with the project, they are replaced by the next successful build (a failed build keeps the previous ones), and you change one by editing the comment and building again. In the editor’s margin they are drawn as a hollow diamond with a dot, and the Breakpoints view lists them in a LOGPOINT comments section. They cannot be deleted from the IDE, but you can disable one: click its mark, or use Disable on its row — it stays disabled across rebuilds until Klive restarts. Right-clicking the mark or the row also offers Show in Disassembly. A comment that cannot be read is a build warning with its file and line, never an error.
When you build with sjasmplus, add this line to your source, or sjasmplus leaves the comments out of its debug data:
SLDOPT COMMENT WPMEM, LOGPOINT, ASSERTIONKlive warns when a source has LOGPOINT, ASSERTION or WPMEM comments but the build delivered
none of that kind, and names this line; it never adds it for you. sjasmplus exports end-of-line
comments only. Its builds also give conditions and logpoints their labels, written with their full
dotted name (module.main.local).
DeZog ASSERTION and WPMEM comments
The other two DeZog comments work too, in the Klive assembler and in sjasmplus (with the SLDOPT
line above).
An ASSERTION stops the machine when its expression is false:
    ld a,c          ; ASSERTION a < 7
    ; ASSERTION hl != 0 && b@(hl) == 0x20
    ld (hl),a
On an instruction’s line it is checked before that instruction runs, so the first one checks
A’s value before ld a,c changes it. On a line of its own it is checked before the next instruction.
A bare ASSERTION always stops. A later ; ends the expression, so the rest of the comment can
explain it. The expression is written the way LOGPOINT placeholders are (above): registers, dotted
labels, b@(…)/w@(…), 0x1F/1Fh, and C precedence — A & 0x80 == 0 means
A & (0x80 == 0). The Breakpoints view shows the expression as you wrote it, and its tooltip and
bp-list show how Klive reads it, with every operation in parentheses.
When an assertion stops the machine, the Emulator output says which one, with the values it read:
ASSERTION failed at main.asm:42: a < 7 (a=$07)A WPMEM comment is a memory watchpoint:
fill_colors:  ; WPMEM, 5, w
    .defs 5
    ; WPMEM 0x0000, 0x4000, w
Its arguments are WPMEM [address [, length [, access]]]. Without an address it watches the
comment line’s own address (in that line’s bank) — note the comma straight after WPMEM when
you give a length but no address. The length is in bytes and defaults to 1; the access is r, w
or rw, the default. The address and length may use labels and arithmetic, but nothing that reads
the machine. The stop is reported as, for example,
WPMEM write at $8002 (fill_colors+2) by PC $8123, main.asm:40.
Like LOGPOINT comments, these breakpoints belong to the build: they are replaced by each
successful build, never saved, and a comment that cannot be read is a build warning. They cannot be
deleted from the IDE — remove the comment — but, also like LOGPOINT comments, you can
disable one: click its mark in the editor’s margin, or use Disable on its row in the
Breakpoints view. A disabled comment stays
disabled across rebuilds while it stays on its line, until Klive restarts. Hovering an assertion’s
mark names the instruction it guards; right-clicking it, or its row, offers Show in Disassembly,
listing every address when a macro expanded the comment more than once.
The Breakpoints view lists them in an ASSERTION comments and a WPMEM comments section. The
checkbox on each section’s header switches that kind on or off for the project — the same as
as-en and wp-en. Both are on by
default (DeZog starts with them off), and the first assertion stop reminds you how to switch them
off.
Bank-Relative Breakpoints
A partition-scoped breakpoint sits at one Z80 address and fires only while a particular partition is paged there. That is the wrong shape for code that moves a bank around: the same routine appears at a different address depending on which slot its bank is in.
A bank-relative breakpoint names the bank and an offset inside it instead, and fires wherever that bank is paged:
bp-set 05:+$0100This breaks at offset $0100 inside 16K bank 5. The bank is a 16K bank number in hexadecimal and the
offset runs from $0000 to $3FFF — the same units a NEX file and the .bank pragma use.
bp-del and bp-en take the same form. Every machine with banks has them: the ZX Spectrum Next
(banks 00-6F), the 128K, +2A/+3/+3E and Pentagon (00-07) and the Scorpion (00-0F). The 48K
and the Timex name their RAM as the 128K does in 48K mode — bank 5 at $4000, bank 2 at $8000,
bank 0 at $C000 — so a breakpoint written for a 48K program keeps its meaning on a 128K. The
ZX80 and ZX81 have no banks.
A breakpoint can also be anchored to a label of the active annotation set (bp-set 07:MainLoop):
it follows the label if the code moves, and it is kept in that annotation file. bp-set ROM:<name>
breaks at a label of the ROM’s annotations. See
Annotations on Every Machine.
A ZX Next memory partition is an 8K page, while a bank here is 16K — so a bank-relative
breakpoint resolves to one of the two partitions making up that bank, depending on whether its offset
falls in the bank’s low or high half. That distinction is what lets the breakpoint tell $0100 in
bank 5 apart from $2100 in the same bank when only one half is paged in. See
Machine-Specific Memory Partitions.
Bank-relative breakpoints are not available for the I/O types, which watch a port rather than memory.
Setting One Without Typing
Open a NEX file and pop one of its banks out into its own document (the button in the bank’s heading), then switch that document to Disassembly. Clicking the breakpoint margin beside a line sets a bank-relative breakpoint at that line’s offset — so it will fire wherever the bank ends up paged when the program runs. The bank preview inside the viewer itself is a plain byte dump and has no margin to click.
Those breakpoints are stored in the file’s .nex.dis sidecar rather than in the project, so they
survive a restart even with no project open — and are kept per NEX file rather than shared
between them.
Each bank’s heading in the NEX viewer shows how many breakpoints that bank carries, so you can see which banks are armed without expanding them; hover the count for the breakdown by type.
Following The Program Counter
While the machine is paused and the program counter is inside the bank you have popped out, that
bank’s disassembly highlights the current instruction, and the toolbar’s bank readout gains a PC
marker naming the offset. It is the same highlight the Disassembly View draws.
Paused only, on purpose: the bank listing does not change as the machine runs, so a mark sampled from a running machine would land on an arbitrary instruction while looking authoritative.
Seeing What The Program Changed
A popped-out bank shows the bank as the machine has it right now, in both its memory and its
disassembly view, with every byte that differs from the file marked and counted in the toolbar. A
Live marker in the toolbar tells you that is what you are looking at. When no machine is running
there is nothing to read, and the bank falls back to the bytes the file holds.
That difference is often the thing you are looking for: self-modifying code, a routine that decompressed itself over its own packed data, or a bank a stray write has damaged. None of it can be told from a clean load by looking at the file.
It works for every bank in the NEX, including banks the program has paged out — the bytes are read from the machine’s RAM, not from the address space. It applies only on the ZX Spectrum Next.
Disassembly Aligned To The Program Counter
Disassembling a bank from its first byte is a guess about where instructions begin. One byte of data decoded as an opcode shifts every boundary below it, and self-modifying code or a jump table can make that guess wrong for the rest of the bank.
A paused Z80 sits between instructions, so the program counter is the one offset where the alignment is known rather than guessed. While the machine is paused with the PC inside the bank, the listing is cut there and re-decoded, so the rows from the PC on are the instructions that will actually run.
A listing that was already aligned at the PC is left exactly as it was, so stepping through ordinary code does not reshuffle it. Where the old alignment was wrong, you will see the instruction straddling the PC overlap the row beneath it — that overlap is the disagreement between the two decodes, and it is shown rather than hidden.
Regions you have annotated as bytes, words or skip are never cut: those say what the bytes
are, and the program counter passing through does not make them code.
A bank-relative breakpoint only fires while its bank is actually paged in — which is the point of it, but it means a breakpoint can look inert simply because the program has that bank paged out right now. The popped-out bank’s toolbar tells you: it reads Bank at $8000 when the bank is in the address space, or Bank not paged in when it is not. Hover it for the 8K slot numbers. A paged-out bank keeps its breakpoints; they fire as soon as it comes back.
Bank Watchpoints
The Memory read and Memory write types work with a bank-relative address, which gives you “stop when this byte of this bank is written, wherever the bank is paged”:
bp-set 05:+$0100 -wTwo ways to get one without typing:
- click the breakpoint margin in a popped-out bank to create an execution breakpoint, then double-click it and change Type in the dialog;
- or use Add breakpoint in the Breakpoints panel and type the bank-relative address in the Address field.
The disassembly margin draws one mark per line, so a line carrying both an execution breakpoint and a watchpoint shows the execution one. Both are always listed in the Breakpoints panel, and both count towards the bank heading’s total.
NextReg Write Breakpoints (ZX Spectrum Next)
Every other breakpoint names a place — an address, an offset in a bank, a source line. A NextReg write breakpoint names an event: stop when a particular Next Register is written.
bp-set nr:$07The Next’s registers are where the machine’s behaviour actually lives: the CPU speed, the MMU slots,
the Layer 2 base, sprite control, the interrupt configuration. When something writes one of them
unexpectedly, the alternatives are an I/O write breakpoint on port $253B, which fires on every
NextReg write in the system including NextZXOS’s own, or reading the disassembly until you spot the
NEXTREG instruction. Neither works well on a .nex file you did not write.
The breakpoint catches a write from the CPU whichever way it arrives: through port $253B, through
the NEXTREG instructions, or from a DMA transfer the program set up.
Breaking On One Value
Add = and a value to break only when that value is written, and / and a mask to compare only some
of the bits:
bp-set nr:$07=$03        ; only when $07 is set to $03
bp-set nr:$07=$03/$0f    ; only when its low nibble becomes $3
The value is part of the breakpoint’s identity, so nr:$07 and nr:$07=$03 are two breakpoints and
both can be set at once. The same thing can be typed as options — bp-set nr:$07 -v $03 -m $0f
— which is what the Breakpoint Dialog writes for you.
Copper Writes
By default only CPU writes break. A copper list runs every frame, so a breakpoint that fired on its
writes would stop the machine constantly. Add -c when the copper is what you are chasing:
bp-set nr:$40 -cThe row and its tooltip say which of the two the breakpoint is watching. Writes performed by a reset or by Klive’s own display hotkeys are never reported.
What You See When It Fires
The machine stops after the instruction that wrote the register, not before it. A Z80
instruction cannot be interrupted part-way, and several NextReg writes can happen inside one of them
— a DMA burst to $253B, or a busy copper list — so a breakpoint that tried to withhold
the write would have to drop or duplicate some of them.
Nothing is lost by this. The breakpoint reports the value the register held and the value just
written, so the row reads $00 → $03: you see both sides of the change rather than only the one a
stop-before would have shown.
The Breakpoints view shows the register’s documented name beside its key, and the old and new values once the machine has stopped on it. The output pane says the same thing in words:
NextReg breakpoint: $07 (CPU speed) $00 -> $03 at PC=$8005The row and the message both name where the write came from — the address of the instruction that did it, and the partition that address was paged from. On a Next the same address means different code depending on what is paged there, so the address alone does not identify the instruction.
Breaking On A Reset
Writing NextReg $02 asks the machine to reset: bit 0 for a soft reset, bit 1 for a hard one. That
makes nr:$02 the most useful breakpoint of the lot and the one with the most to go wrong, because
a reset discards exactly the two things you set the breakpoint to find out.
bp-set nr:$02Klive stops before carrying the reset out. The machine is still standing where the write happened: the program counter, the MMU slots and every other register are as the program left them, and the Memory view shows the paging that was in force. The reset is performed when you resume.
This is the one place where a NextReg breakpoint changes when the machine does something, rather
than only watching. Without a breakpoint on $02, or with one that is disabled, the reset happens
exactly as it always did.
These breakpoints are stored in the project, not in a .nex.dis sidecar: they watch a hardware
register, so they mean the same thing whichever NEX file is loaded.
Copper Breakpoints (ZX Spectrum Next)
A Copper breakpoint names another event: the Copper completes an instruction of its list. The
list holds 1024 instructions, so the breakpoint names a list index, $000 to $3FF:
bp-set cu:$00B- A
MOVE(or aNOP) fires when the Copper issues it. - A
WAITfires when its condition is satisfied — when the raster reaches the line and position it waits for — not when the Copper arrives at it. That is the moment that matters: “the beam has reached line 96”. - The
HALT(WAIT 511,63) never completes, so a breakpoint on it never fires.
Hit counts, conditions, logpoints and one-shots work as on any other breakpoint. A list that runs
once per frame passes each instruction once per frame, so -hit counts frames:
bp-set cu:$00B -hit 50      ; the 50th frame
bp-set cu:$00B -once        ; once, then the breakpoint is removed
In a condition, ADDR is the list index and VAL is the 16-bit instruction word, so
-if VAL != $BE78 stops only when the CPU has patched the instruction.
The Copper runs on to the end of the Z80 instruction. The Copper executes at 28 MHz, locked to the beam, and the machine can only stop between Z80 instructions. By the time it stops, the Copper may have completed several more instructions. The stop message, the Breakpoints view and the Copper List therefore report the hit — the instruction and the beam position where it completed — separately from where the Copper is now.
Copper breakpoint: $002 WAIT 96, 8 satisfied at line 96, hc 76 (x 64); CPU at $8019 in 05You can set a Copper breakpoint from the Copper List’s gutter, from the Copper instruction type
of the Breakpoint Dialog, or by clicking the margin of a .copper source
line while the program runs: Klive finds where that line’s instruction sits in the Copper’s memory
and sets the breakpoint on that index.
Sprite Attribute Breakpoints (ZX Spectrum Next)
A sprite attribute breakpoint stops when an attribute byte of a sprite is written. It names the
sprite, $00 to $7F:
bp-set sp:$0CIt catches every way the hardware stores an attribute byte:
- port
$57, written by the CPU (OUT,OTIR) or by the DMA; - the NextReg mirrors
$35-$39and$75-$79on the sprite$34selects, written by the CPU (NEXTREG, port$253B), the DMA or the Copper.
Selecting a sprite ($303B, $34) is not a write. A four-byte sprite (attribute 3, bit 6 clear) skips
its fifth byte without writing it, so a breakpoint on attribute 4 does not fire for it.
To watch only some of the five bytes, add -attr with a list. Attributes 0 and 1 hold X and Y, so
this stops only when sprite 12 moves:
bp-set sp:$0C -attr 0,1
bp-set sp:$0C -attr 0-3 -hit 10
Hit counts, conditions, logpoints and one-shots work as on any other breakpoint. In a condition,
ADDR is the attribute byte (0-4) and VAL is the value written, so
-if ADDR == 3 && (VAL & $80) == 0 stops when the sprite is made invisible.
The machine stops after the instruction during which the byte was written, and the stop message reports the byte’s previous and new values and who wrote it:
Sprite breakpoint: sprite $0C attr 0 (X) $00 -> $40 through port $57, written at $800C in 05
Sprite breakpoint: sprite $14 attr 3 (visible, pattern) $00 -> $C0 by the Copper, with the CPU at $8026
You can set a sprite attribute breakpoint from the Sprite Inspector: right-click a sprite and choose Break on attribute write, or Run until attribute write for a one-shot. The Sprite attribute write type of the Breakpoint Dialog has a checkbox for each attribute byte.
Resolved Source Code Breakpoints
When you open a project or modify an assembly source code file, the source code breakpoint addresses are not resolved to an actual physical address. The orange color of a source code breakpoint indicates this status:
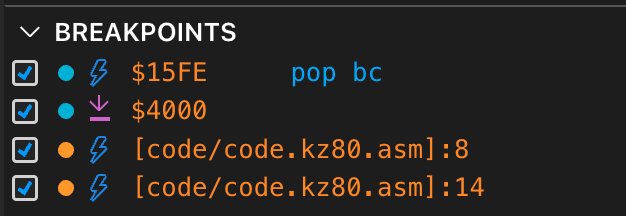
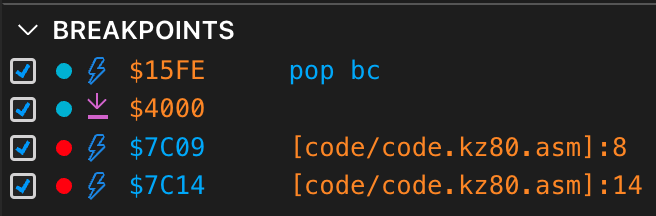
Source code breakpoints are resolved to a CPU address after compilation, and this address is displayed with the breakpoint. The following figure shows that the last two source code breakpoints display their resolved CPU address after the compilation.
Breakpoint Types
The second icon of the breakpoint item displays its type. Every machine has five types of breakpoints (depending on the operation triggering the machine to pause), shown in the following figure; the ZX Spectrum Next adds three more.
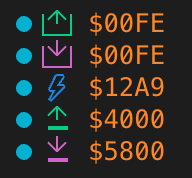
These are the available breakpoint types (from top to bottom in the figure):
- I/O read. This breakpoint is triggered when a particular I/O port has been read. The displayed address is the 16-bit I/O port address.
- I/O write. This breakpoint is triggered when a particular I/O port has been written. The displayed address is the 16-bit I/O port address.
- Execution. This breakpoint is triggered when the PC register reaches the specified address.
- Memory read. This breakpoint is triggered when an instruction reads a particular 16-bit memory address as data. Fetching the instruction’s own opcode and operand bytes does not count. Every data access of an instruction is examined, so
LD HL,($8000)triggers a read breakpoint on$8000as well as on$8001. - Memory write. This breakpoint is triggered when a particular 16-bit memory address has been written.
The first of the ZX Spectrum Next’s three is NextReg write, which is triggered when a Next Register is written rather than when a place in memory is touched — see NextReg Write Breakpoints. The other two are the Copper instruction and the sprite attribute write. All three watch a machine event rather than an address, so they have no margin to click and no disassembly beside them.